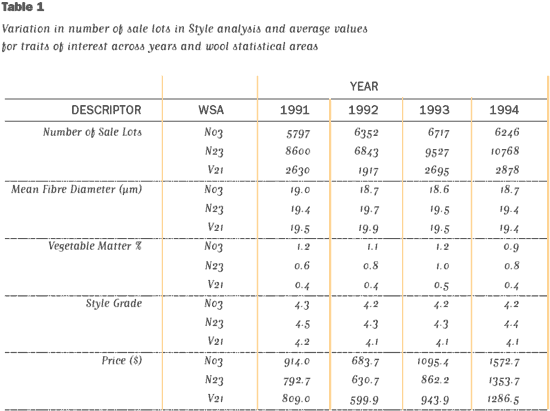
As part of the CSIRO Fine Wool Project, analyses of wool sale data have been carried out to estimate the real value of differences in the style of a sale lot of wool. This information is important to enable breeders to place appropriate emphasis on this trait in their breeding programs.
We have examined the entire sale lot data from three wool statistical areas over four years (1991–1994). The wool statistical areas were chosen to be examples of fine and superfine wool growing regions, and they were:
- Wool Statistical Area N03: New England Tablelands, NSW
- Wool Statistical Area N23: Fine wool area around Yass, Goulburn, Booroowa, NSW
- Wool Statistical Area V21: Fine wool area around Hamilton, Victoria.
From the available sale lots designated as originating from these three areas, we then chose only those lots that satisfied the following conditions:
- From the sale lots originating from the chosen WSAs, brand names (clips) were chosen as being representative of fine/superfine wool production if the fleece lots from that clip, in that year, averaged (on a weighted basis) less than 21.6 µm.
- Only those lots described as adult fleece wools (on the basis of the AWC type allocated) were included in the analysis.
- From the sale lots representing the chosen brand names, fleece lots with pre-sale measurement of mean fibre diameter greater than 21.6 µm were excluded from the subsequent analyses.
- To eliminate typographical errors and exclude lots that did not reflect the typical distribution of types from fine wool areas, lots with prices less than 200¢ per kg clean were excluded from the analysis.
- To attempt to include only those sale lots where prices received reflected the average value of whole fleece production and not selected portions of selected fleeces, all lots receiving prices of greater than 10,000¢ per kg clean were excluded from the analysis. This resulted in a maximum of 10 lots being excluded from any WSA in any one year.
These prerequisites resulted in a data set for the analysis as indicated in Table 1.

As can be seen from the Table the wools averaged close to Best Topmaking types. Also noticeable is the extreme volatility in price across years.
The statistical analysis we conducted to isolate the effect of differences in style took account of all the identifiable influences on price. By including these factors that influence price in one large equation, we can end up with an estimate of the effect of style grade on price free from the biasing effect of all other factors.
Results
In general, the results show the following:
- Premiums for changes in style grade in sale lots from fine and superfine wool flocks are substantial on a per grade basis and a consistent pattern against micron category was established. That is, premiums for improved style grades get less as wools increase in mean fibre diameter.
- Premiums for an improvement of one style grade averaged approximately 200¢. However, this ranged from zero at 21 µm, through to more than 500¢ for lots less than 17.5 µm.
- The differences in premium for style changes between the three regions were smaller than those associated with diameter groups.
These results are currently being extended to include other fine wool growing areas, and to also include more recent years.
These results are highly significant for fine and superfine wool growers. Rewards are certainly there for production of high quality fleeces.
From a ram breeding perspective the results are also important. The relative importance of style premiums in the context of a breeding program will depend on how variable the trait is in a breeding flock, how heritable is the trait, and the relationships with other traits of economic importance which are used as selection criteria.
Work is continuing in the CSIRO Fine Wool Project to formally incorporate style and the other additionally measured traits, such as length and strength, into index equations that can be customised for individual breeders.
In this issue of The Wool Press: